


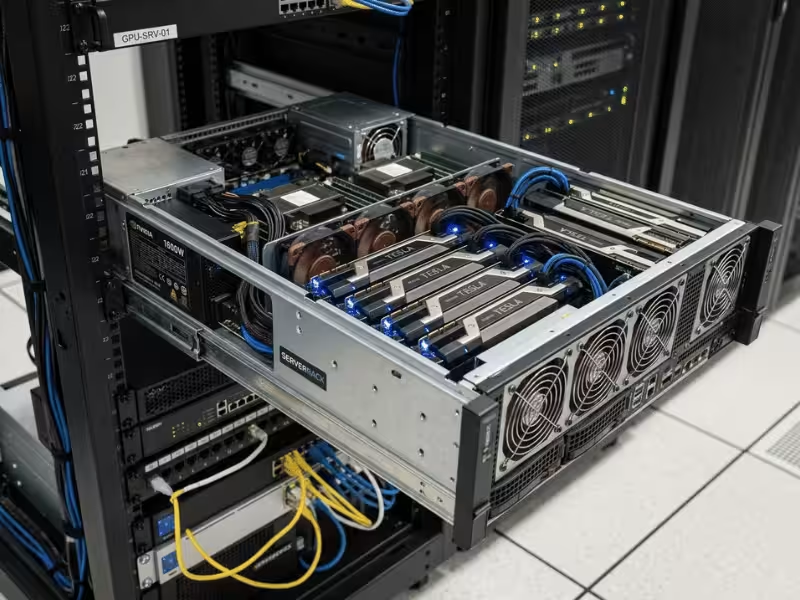
Your GPU is probably fast enough. The problem is you’re not feeding it in time.
I’ve worked on enough GPU pipelines to know that most transfer bottlenecks aren’t where people expect them to be. Teams blame the hardware, then buy a bigger card, and the numbers barely move.
The real fixes are simpler. Check the PCIe link. Switch to pinned memory. Use async copies. Batch small transfers. Overlap copy with compute.
That’s most of the win, right there.
This guide walks you through it in order: diagnose the bottleneck, apply the high-impact fixes, then choose the right advanced option only when your workload needs it.
Let’s find out what’s actually slowing you down.
What Limits CPU to GPU Transfer Speed
Before you touch a single line of code, it helps to know what you’re fighting.
Your data lives in host memory. Your GPU needs it in device memory. To get there, it usually travels across the PCIe bus. (Yes, transfers go both ways — host to device and back — but the same rules apply in both directions.)
Every transfer you make costs you two things.
Fixed overhead. Each copy has setup work: the driver call, synchronization, launch cost. This price is the same whether you send 4 KB or 4 MB.
Link bandwidth. Once the data starts moving, it can only flow as fast as the PCIe link allows.
Here’s why that matters. Small transfers rarely get near the link’s peak, because the fixed overhead eats most of the time before any real data moves. Large transfers behave differently — they run long enough that bandwidth becomes the real ceiling.
So a single big copy can look great on paper while a thousand tiny copies crawl, even though both move the same total bytes.
This split gives you a fast way to guess where your problem lives.
If your workload fires off frequent small batches with high-frequency calls, look at your call pattern and transfer count first. You’re probably drowning in overhead.
If you move large blocks of data, the overhead barely registers. Your suspects become the link itself, pageable memory, NUMA placement, and whether you overlap transfers with compute.
Knowing which camp you’re in saves hours. You stop optimizing the wrong thing and start measuring the right one.
How to Tell What Is Actually Slowing You Down
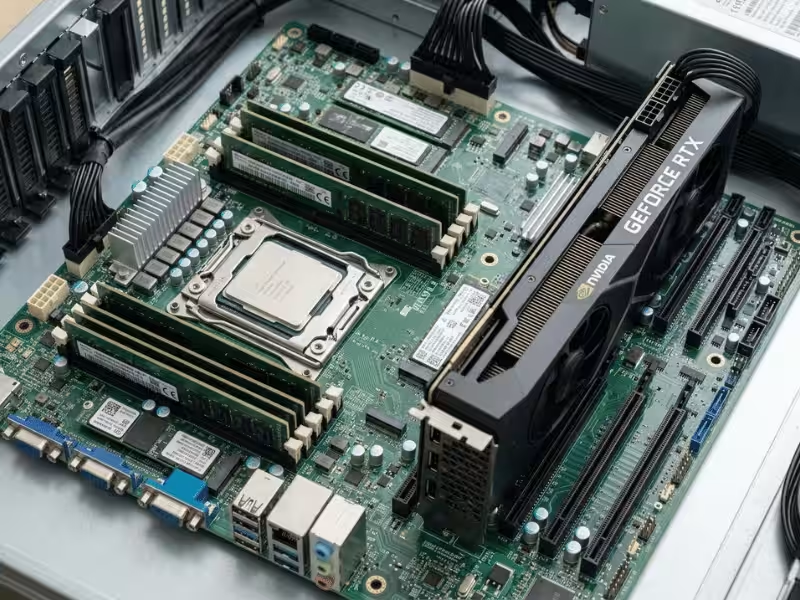
Guessing wastes time. Before you change anything, spend ten minutes measuring so you know which problem you’re actually solving. Three questions get you most of the way there.
Are you limited by link bandwidth or copy overhead?
Run a clean benchmark. Push a single large block — somewhere between 256 MB and 1 GB — and measure the throughput with CUDA events, which give you accurate timing on one copy.
Now compare that number to your link’s theoretical peak.
If your big transfer still comes in well below what the link should deliver, stop looking at your code. Check the physical link and your memory type instead — pageable host memory alone can cut your bandwidth in half.
But if your job is full of tiny transfers, the story flips. You’ll never hit peak bandwidth with small copies, because overhead dominates. Your problem is the call pattern, not the link.
Are transfers blocking compute?
Sometimes bandwidth is fine and the job is still slow. That usually means your copies and your kernels are taking turns instead of working together.
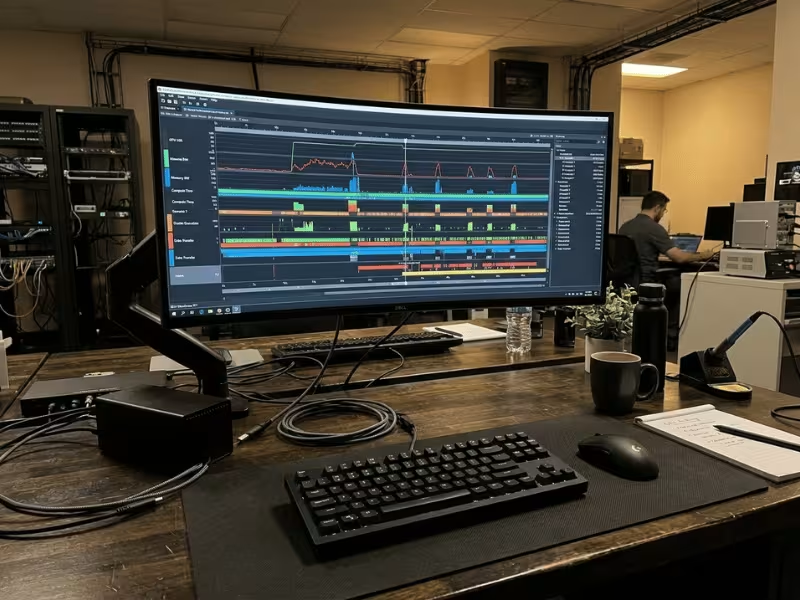
Open Nsight Systems and read the timeline. You want to see where the gaps are.
If the copy finishes, then the kernel starts, then the next copy begins, you’ve got a serialized pipeline. The GPU sits idle during transfers. The CPU sits idle during compute. Everyone waits.
That’s not a bandwidth problem. That’s a missing overlap. No faster link will fix it, because the link isn’t the thing holding you back — the ordering is.
Are you copying data more often than necessary?
This is the one people miss most.
Look for the same data crossing the bus again and again. A few patterns give it away:
- The same buffer copied in a loop instead of once.
- A copy up and a copy back around every single kernel launch.
- Intermediate results bouncing to the host, then straight back to the device for the next step.
Each round trip pays the full transfer tax. Keep results on the GPU between kernels and a lot of that traffic simply disappears.
Nsight Systems makes this obvious. When the timeline shows a wall of small transfers where you expected one, you’ve found it.
Work through these three questions in order. By the end, you’ll know whether to fix your hardware path, your overlap, or your data flow — and you won’t burn hours optimizing the part that was never the bottleneck.
Start With the Highest-Impact Fixes
You don’t need every trick. You need the right few, in the right order.
Once you know where your bottleneck lives, work through the fixes by impact. Here’s the order I use:
- Pinned memory — the single fastest way to lift real bandwidth.
- Asynchronous copies — stop letting transfers block your CPU.
- Batching transfers — kill the overhead from a swarm of tiny copies.
- Overlapping copy and compute — hide transfer time behind work you’re already doing.
- PCIe and NUMA placement — raise the ceiling when software tuning stalls.
Start at the top. Most workloads win big before they ever reach the bottom.
Use Pinned Memory First
If you make one change today, make it this one. Pinned memory is the closest thing to free bandwidth you’ll find.
Here’s the problem it solves. When you allocate a normal host buffer with malloc, the operating system can move that memory around or swap it out. The GPU can’t read from memory that might wander off. So the driver quietly does extra work: it copies your data into a temporary page-locked staging buffer, then sends that across the PCIe bus.
You paid for one copy. You got two.
That hidden staging step is why so many people benchmark pageable memory and watch their bandwidth stall at half the link’s rating. The link isn’t the issue. The double copy is.
Pinned memory skips it entirely. When you allocate with cudaHostAlloc or cudaMallocHost, the buffer stays locked in physical RAM. The GPU reads it directly. No staging, no second copy, and your throughput climbs close to the PCIe ceiling.
When it pays off most:
- Frequent transfers. Any buffer you send across the bus over and over.
- Large host-to-device copies. The bigger the block, the more the staging tax hurts, and the more you save by removing it.
- Reused host buffers. Allocate once, pin once, transfer many times.
Picture a training loop that pushes the same input batch to the GPU every iteration. People dive straight into the kernel, hunting for speedups. Don’t. Switch that host buffer to pinned memory first. You’ll often see the transfer time drop before you’ve touched a single line of compute code.
Now the warning, because pinned memory isn’t a free-for-all.
Page-locked memory can’t be swapped. Pin a few gigabytes and you’ve taken that RAM away from the operating system and every other process on the box. Pin too much and the whole machine crawls — your GPU code runs great while everything around it chokes.
So pin with intent. Reserve it for the buffers that actually move often or move big. A one-off transfer of a small array won’t reward the effort, and a temporary buffer you touch once isn’t worth locking down.
Replace Blocking Copies With Asynchronous Transfers
Pinned memory gets your data moving fast. But if every copy still stops the CPU cold, you’re leaving most of that speed on the table.
Here’s the trap. A plain cudaMemcpy blocks. The CPU calls it, then stands still until the last byte lands on the GPU. Nothing else happens. Your host thread waits, your kernel waits, and the whole pipeline runs one step at a time.
Now flip that around. cudaMemcpyAsync returns right away. The copy starts, and the CPU keeps working while data flows in the background.
The speed of a single copy doesn’t change. That’s the part people miss. Async copies aren’t magically faster on their own — their real value is what they let you do next. They break the “copy, then wait, then compute” chain and open the door to overlap. Transfer and work can finally happen at the same time.
One catch: async copies need pinned host memory to run truly asynchronously. Feed cudaMemcpyAsync a pageable buffer and it quietly falls back to blocking behavior. So the two fixes go together — pin the buffer first, then make the copy async. Skip the first step and the second one does nothing.
Think about when this actually pays off.
Chunked data processing. You split a large dataset into pieces. While the GPU chews on chunk one, chunk two is already on its way. No idle gaps between pieces.
Inference pipelines. Requests arrive in a stream. Async copies let the next input load while the current one runs through the model. Throughput climbs without touching the model itself.
Batch prefetching in training. This is the classic win. Your GPU crunches batch N while batch N+1 quietly moves across the bus. By the time the kernel finishes, the next batch is already sitting in device memory, ready to go.
The pattern behind all three is the same. If every copy must finish before compute begins, the GPU waits periodically for data — and a waiting GPU is wasted money.
Async copies alone won’t force that overlap, though. You have to organize the work so transfer and compute land on separate timelines. That’s where CUDA streams come in.
Batch Small Transfers and Keep Data on the GPU Longer
Sometimes the fix isn’t a faster copy. It’s a smaller number of copies.
This is where a lot of people plateau. They pinned their memory, they went async, and the numbers barely budged. That’s a signal — and it usually points to how often you’re crossing the bus, not how fast.
Batch small copies into larger ones
Remember the two costs from earlier: fixed overhead per copy, and bandwidth once the data flows. Small transfers get crushed by the first one.
Every cudaMemcpy pays a setup tax. The driver call, the launch, the sync — that price is the same whether you move 4 KB or 4 MB. So when you fire off fifty tiny copies, you pay that tax fifty times before any real data moves.
Bundle those fifty into one large transfer and you pay it once.
The math is brutal for small payloads. A copy under a few hundred KB spends more time on overhead than on actual data movement. You’re not bandwidth-limited. You’re call-limited.
So pack your data. Stage the small pieces into one contiguous host buffer, send it in a single shot, and let one transfer do the work of fifty. The bytes are identical. The overhead is a fraction of what it was.
Avoid unnecessary round trips
The other trap is data that keeps bouncing.
Watch for this pattern: a kernel runs, its result copies back to the host, then straight back to the GPU for the next kernel. That result never needed to leave. Each round trip pays the full transfer cost for nothing.
Keep intermediate results on the device. If kernel A feeds kernel B, let the output sit in device memory and hand it straight over. No detour through the host.
Fuse kernels where you can. When two operations run back to back, merging them means the partial result never touches the bus at all — it stays in registers or shared memory.
And upload once per iteration, not once per kernel launch. If the same input feeds several kernels, send it once and reuse it.
Here’s the insight that saves the most time. If your transfer tuning showed little improvement, stop tuning transfer speed. The problem is almost certainly transfer frequency and count. You’re not moving data too slowly — you’re moving it too often.
Fix that, and the traffic that was clogging your timeline simply disappears.
Overlap Transfer and Compute With CUDA Streams
Everything so far made each transfer cheaper or fewer. Streams do something different — they let transfers and compute happen at the same time.
Here’s the shift in thinking. You’re not chasing a faster single copy anymore. You’re cutting the total time your pipeline spends waiting. The GPU should never sit idle during a transfer, and a transfer should never wait on a kernel that’s already done.
The pattern that gets you there is simple to picture. Split your work into chunks. While the GPU computes chunk N, chunk N+1 is already moving across the bus. When the kernel finishes, the next chunk is waiting. No gaps, no idle time — just a steady flow of work and data side by side.
Why the default stream ruins this
There’s one thing that quietly kills overlap: the default stream.
If every copy and every kernel lands on the default stream, CUDA runs them one at a time. Copy, then compute, then copy, then compute. Serialized. It doesn’t matter that your copies are async and your buffers are pinned — the ordering forces everyone to wait their turn.
To break that, you put transfers and kernels on separate streams. Work on different streams can run concurrently. The GPU’s copy engine moves chunk N+1 while its compute units chew on chunk N.
You’ll also need a way to keep order where order matters. That’s what CUDA events do. A kernel shouldn’t start on data that hasn’t finished arriving, so events act as checkpoints — “this copy is done, now the kernel can go.” Streams create the parallelism; events keep it correct.
When streams are worth the trouble
Streams add real complexity. Reach for them when the payoff justifies it. They shine when three things line up:
- Your data splits naturally into chunks. Independent pieces overlap cleanly.
- Both copy time and kernel time are non-trivial. You need enough of each to hide one behind the other.
- The pipeline load is steady. A predictable stream of work overlaps far better than bursty, uneven jobs.
Hit all three and streams can nearly erase transfer time from your timeline.
Now the boundary condition, because streams aren’t always the answer. If your data can’t split into clean chunks, there’s nothing to pipeline. And if each batch is tiny, the overhead of juggling streams and events can outweigh what little overlap you gain. In both cases, you’ll get more from the simpler moves — batching your small transfers and pinning your buffers.
So don’t jump to streams because they sound advanced. Reach for them when your workload has the shape that rewards overlap: real chunks, real compute, and a steady rhythm.
Check the Hardware Path Before Blaming the Code
You can pin every buffer and stream every copy, and still hit a wall. When that happens, the code isn’t the problem — the physical link is. Two things quietly cap your bandwidth, and both are worth checking before you touch another line of software.
Verify PCIe generation and lane width
Your GPU talks to the CPU over a set number of PCIe lanes, and lane count matters as much as clock speed.
A full x16 slot gives you the whole link. Drop to x8 and you’ve cut usable bandwidth in half. Drop to x4 and you’re down to a quarter — no code change gets that back.
Generation stacks on top of that. Each PCIe generation roughly doubles the per-lane rate. A Gen 4 x16 link delivers close to twice what Gen 3 x16 does, and Gen 5 doubles it again. So a Gen 3 x8 slot can quietly hand you a fraction of what you assumed you were running.
Here’s the trap people fall into: lane sharing. Plug in a second GPU or a fast NVMe drive, and the motherboard often reroutes lanes to feed it. Your x16 slot silently becomes x8. Nothing warns you. This is one reason the physical layout of your build matters — a well-designed GPU server case gives each card room to sit in a full-width slot without fighting for lanes.
Check the real link with nvidia-smi -q. Look at both the current width and generation, not the spec on the box. The numbers often disagree.
Check NUMA and socket locality
On a dual-socket server, distance costs you.
Your GPU physically attaches to one CPU socket. If the thread doing the transfer runs on the other socket, your data crosses the inter-socket link before it ever reaches the GPU. That extra hop drags down bandwidth and adds latency you didn’t budget for.
The fix is placement. Bind the transfer thread — and its pinned buffer — to the same NUMA node as the GPU. Keep the whole path local.
Run nvidia-smi topo -m to see the map. It shows which CPU cores sit closest to each GPU and how every device connects. Read that affinity column, then pin your threads to match.
None of your software wins survive a broken hardware path. If the link runs at x8 or your transfers route through the wrong socket, you’ve already capped the ceiling — and every optimization above it just fights for scraps under a limit you set by accident.
When Advanced Options Are Worth It
By now you’ve done the heavy lifting — pinned buffers, async copies, batching, overlap, a clean hardware path. If your numbers still fall short, these three options are worth a look. Just know what each one actually solves before you reach for it.
Unified Memory
Unified Memory makes life easier. You allocate once with cudaMallocManaged, and the driver moves pages between host and device for you. No manual copies to track.
Easier isn’t the same as faster.
Under the hood, pages migrate on demand. The first time your kernel touches data that lives on the host, it stalls on a page fault while that memory moves. For large, sequential transfers you already understand, an explicit cudaMemcpy usually wins — you control exactly when the data moves and pay no fault penalty.
So use Unified Memory for convenience or messy, irregular access patterns. Don’t expect it to beat a well-placed copy on bulk data.
NVLink
NVLink gets mentioned a lot, and it confuses people. It’s a high-bandwidth link — but mostly between GPUs, not between your CPU and GPU.
If you run a single GPU, NVLink won’t touch your host-to-device transfers. Those still cross PCIe. NVLink earns its keep in multi-GPU work: peer-to-peer copies, model parallelism, shared datasets across cards. Those dense multi-GPU builds run hot, too, which is why many of them live in a 4U GPU server case built to keep several cards cool under sustained load.
Great tool. Wrong problem, if your bottleneck is CPU to GPU.
GPUDirect Storage and RDMA
These paths cut the CPU out of the loop entirely.
GPUDirect Storage moves data straight from fast NVMe into GPU memory, skipping the bounce through host RAM. GPUDirect RDMA lets a network adapter write directly into GPU memory over the wire. Both remove a copy and free up the CPU.
They’re powerful when your data comes from fast storage or the network at scale. For most workloads feeding data from host memory, they’re not step one — they’re what you evaluate after the fundamentals stop paying off.
Common Mistakes That Waste Transfer Bandwidth
I’ve watched teams do everything right and still lose bandwidth to the same handful of habits. Here are the ones I run into most.
Expecting full bandwidth from pageable memory. You benchmark, the number sits at half the link rating, and you blame the hardware. The hardware is fine. Pageable memory forces a hidden staging copy. Pin the buffer and the number jumps.
Using blocking cudaMemcpy in a loop. Each copy stops the CPU cold, then the next one starts. Nothing overlaps. Async copies on real streams would hide that latency behind compute you’re already doing.
Sending many small transfers. Fifty tiny copies pay the setup tax fifty times before any real data moves. Bundle them into one large transfer and you pay it once.
Ignoring NUMA on multi-socket servers. If your transfer thread runs on the wrong socket, data crosses the inter-socket link before it even reaches the GPU. Bind the thread and its buffer to the GPU’s own NUMA node.
Treating Unified Memory as automatically faster. It’s convenient, not magic. The cost doesn’t vanish — it moves to page faults that stall your kernel on first touch. For bulk sequential data, an explicit copy usually wins.
Pinning too much host memory. Page-locked memory can’t be swapped. Pin a few gigabytes and you starve the OS and every other process on the box. The GPU code flies while the whole machine crawls.
Mixing cold and warm cache runs. Your first run touches cold caches and cold buffers; the third run doesn’t. Compare them and the numbers lie. Warm up first, then measure several runs consistently.
Fix these, and most of your “mystery” bandwidth loss stops being a mystery.
A Practical Optimization Workflow
The order you tackle these fixes matters as much as the fixes themselves. Work through them from the ground up, and you’ll never waste effort optimizing above a limit you set by accident.
Here’s the sequence I follow:
- Measure your real throughput first. Push large blocks both ways — host to device and back — and record the actual GB/s. You can’t improve what you haven’t measured, and this baseline tells you where you stand against the link’s peak.
- Check the hardware path. Confirm your PCIe generation, lane width, and NUMA placement. If the link runs at x8 or crosses the wrong socket, fix that before you touch a single line of code. Everything above sits under this ceiling.
- Pin your high-frequency buffers. Any buffer that crosses the bus often should live in page-locked memory. This is the fastest bandwidth win you’ll get.
- Make blocking copies async. Switch to
cudaMemcpyAsyncso transfers stop freezing your CPU. This also sets up the overlap you’ll add later. - Batch small transfers. Bundle a swarm of tiny copies into one large one and kill the per-call overhead.
- Keep intermediate results on the GPU. Stop bouncing data to the host between kernels. Cut the round trips.
- Add stream overlap. Once transfers are cheap and few, pipeline them so copy and compute run side by side.
- Evaluate the advanced options last. Only now weigh NVLink, GPUDirect, or Unified Memory — after the fundamentals stop paying off.
Re-measure after each step. Real numbers, not assumptions, tell you when to move on.
FAQ
What is a realistic CPU to GPU transfer speed over PCIe Gen 4 x16?
Gen 4 x16 has a theoretical peak near 32 GB/s. In practice, you’ll see roughly 24–26 GB/s with pinned memory on a large, clean transfer. That gap is normal — protocol overhead and encoding eat the rest. If you’re using pageable memory, expect closer to 12–13 GB/s, since the hidden staging copy halves your effective rate. When your big transfers land well below 24 GB/s with pinned buffers, look at the physical link or NUMA placement, not your code.
Does pinned memory always improve transfer speed?
For transfers, yes — it removes the staging copy and lets the GPU read host memory directly. But it isn’t free everywhere. Pinning takes RAM away from the OS and locks it down permanently. Pin a few gigabytes and the rest of your system slows to a crawl. It also doesn’t help a one-off copy of a tiny buffer, where the pinning cost outweighs the gain. Reserve it for buffers that move often or move big.
Is unified memory faster than cudaMemcpy?
Usually not, for bulk sequential data. Unified memory migrates pages on demand, so your kernel stalls on a page fault the first time it touches host-resident data. An explicit cudaMemcpy moves everything up front, with no fault penalty and full control over timing. Unified memory wins on convenience and messy, irregular access patterns — not raw throughput. Prefetch calls and cudaMemAdvise narrow the gap, but a well-placed copy still beats it on large blocks.
Can I overlap CPU to GPU transfers with kernel execution?
Yes, and it’s one of your biggest wins. You need two things: pinned host memory and separate CUDA streams. Put your copy on one stream and your kernel on another, and the GPU’s copy engine moves the next chunk while its compute units work on the current one. The catch is the default stream — send everything there and CUDA serializes it, killing the overlap. Use events to enforce ordering where a kernel depends on data still arriving.
Why is my GPU showing only part of the expected PCIe bandwidth?
Three usual suspects. First, pageable memory — it forces a double copy and caps you near half the link rate. Second, lane downgrade — adding a second GPU or NVMe drive often reroutes lanes, quietly dropping your x16 slot to x8. Third, wrong PCIe generation, where a Gen 4 card sits in a Gen 3 path. Run nvidia-smi -q and check the current link width and generation, not the spec sheet. The reported numbers often disagree with what you assumed. In dense multi-GPU rigs, thermal throttling can add a fourth culprit — a reason liquid-cooled GPU server cases show up in heavy training setups.
Wrapping Up
Start every transfer problem the same way: figure out what’s holding you back. Is it the link and the hardware path, or is it your code and how you call it? That one question decides everything you do next. Fix the wrong thing and you’ll burn hours for nothing.
For most workloads, the biggest gains come from four moves, in this order: pinned memory, async copy, batching, and overlap. Work through them top to bottom. Most jobs win big before they reach the end of that list.
And measure every step. Record your throughput before a change, apply it, then measure again. Don’t assume a fix helped — prove it. Real numbers tell you when to keep going and when to stop.
In most systems, the link sets the ceiling. How you implement the transfer decides how close you get to it.
