


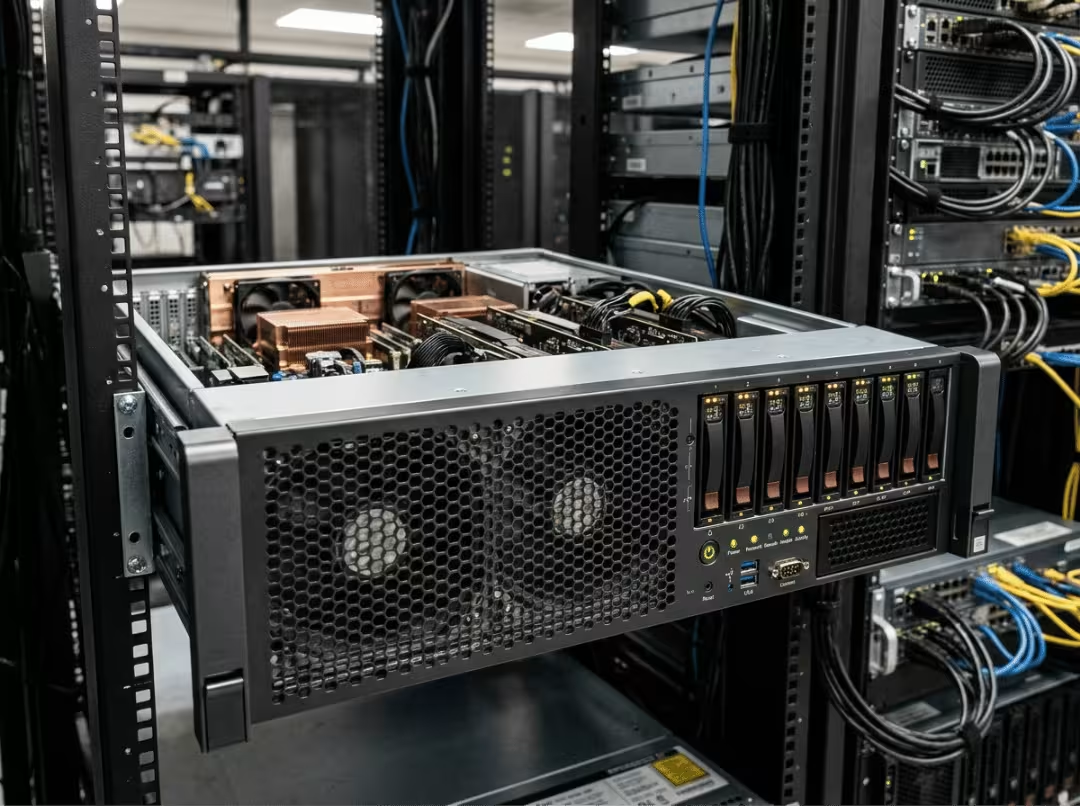
Your GPU is quietly downclocking mid-job, and the utilization graphs aren’t telling you why. Server GPU throttling doesn’t behave like desktop throttling — shared power budgets, rack-level cooling, and BMC/IPMI-level controls all come into play, so “check the fans” only gets you partway there.
The good news: a GPU throttled in a server almost always traces back to one of four limit categories — thermal, power, software/firmware, or hardware. Finding which one you’re hitting is methodical, not guesswork. This article covers the common causes behind each type and exactly what to check first. For full remediation steps once you’ve identified the cause, see the full diagnose-and-fix guide.
What GPU Throttling Actually Looks Like in a Server
GPU throttling is the card reducing clock speed or power draw to stay within a defined limit. It’s a protective response, not a failure state — the GPU is doing exactly what it’s designed to do. The question is which constraint triggered it.
On a desktop, throttling is loud and obvious: fans spin up, frame rates drop, temperatures spike. In a server, the symptoms are quieter and easier to miss. You’ll see inconsistent job completion times across identical runs, lower-than-expected FLOPS or tokens-per-second, or clocks dipping mid-workload with no clear trigger in the logs.
Common server-specific signs include:
- Sustained clocks sitting below boost spec for extended periods
- Power draw plateauing below the card’s rated TDP
- Performance inconsistencies across identical GPUs in the same chassis
- Job runtime variance that doesn’t scale with workload size
In production inference or training environments, throttling silently inflates job time and cost per run. Because it’s often intermittent, it goes unnoticed until someone audits GPU-hours against expected throughput. At this stage, the goal isn’t to fix anything — it’s to identify which limit is being hit.
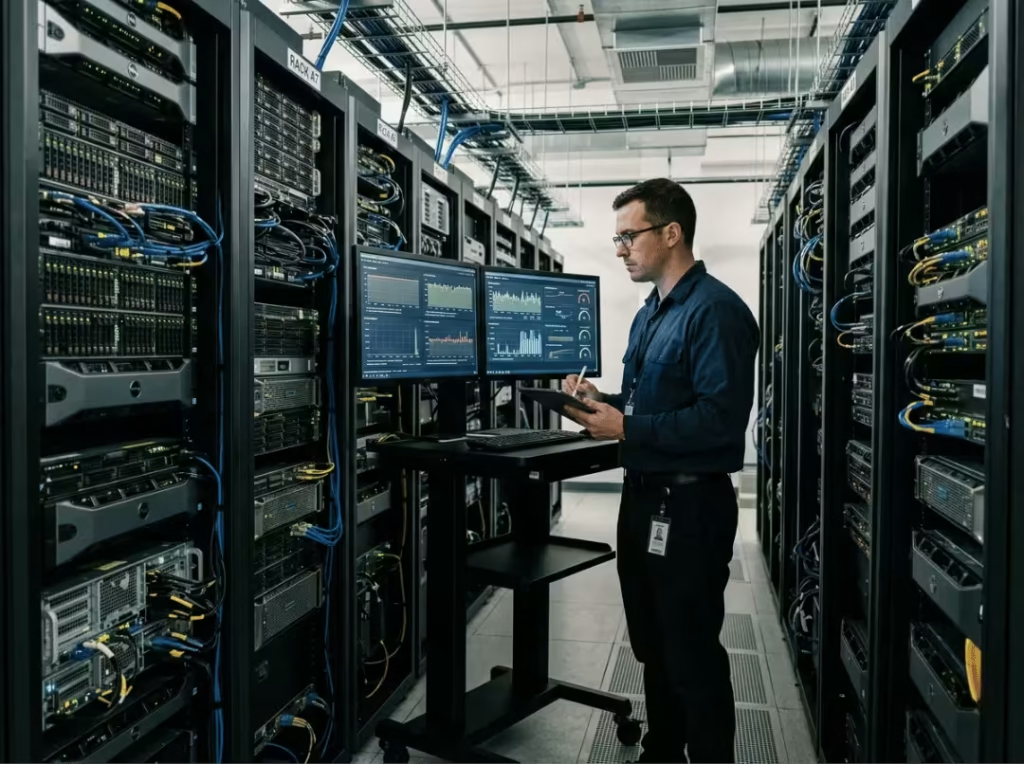
Thermal Throttling: The First Thing to Rule Out
Thermal throttling is usually the first suspect. It’s also the fastest to confirm or eliminate.
What causes thermal throttling in servers?
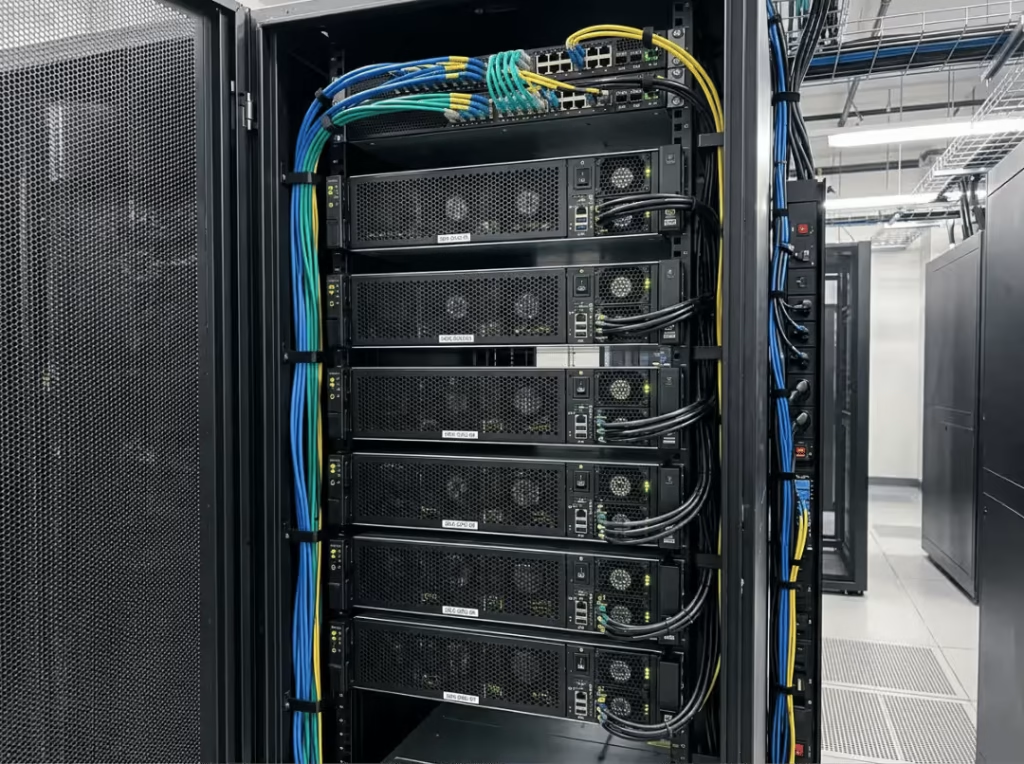
Hot rack intake air is a frequent trigger, especially in racks with poor airflow planning or gaps where blanking panels are missing. Dust accumulation on heatsinks and fans, degraded fan bearings, and dried thermal paste on older cards all contribute.
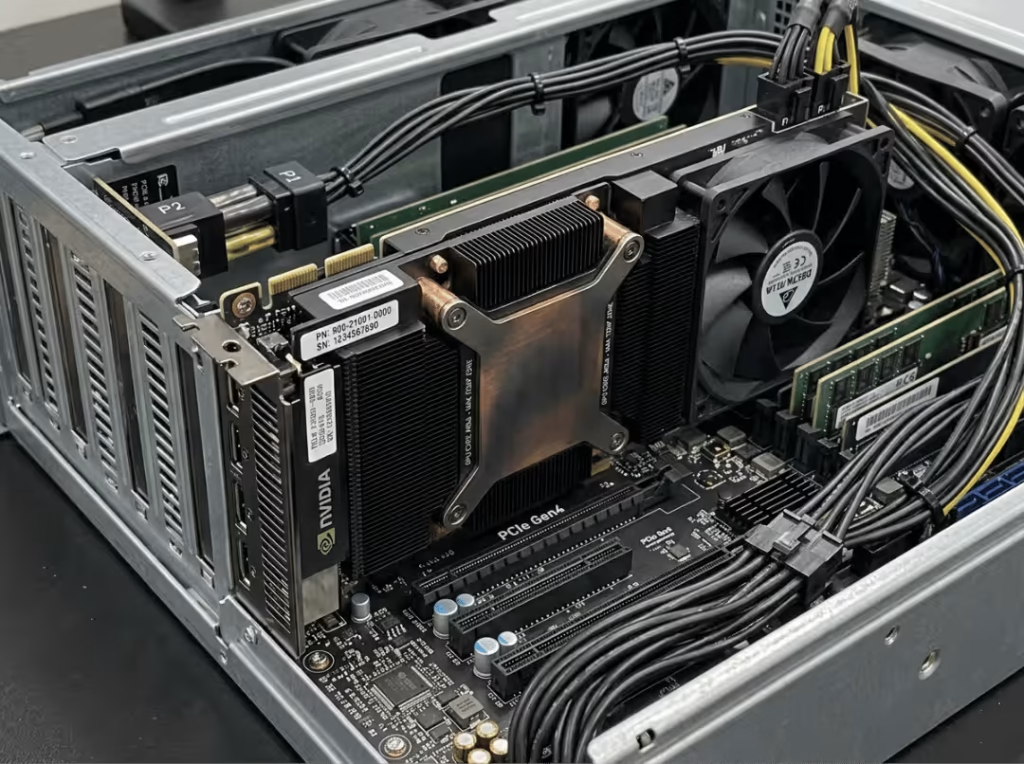
One distinction is easy to miss: edge temperature (the board-side sensor) versus hot spot or junction temperature. A GPU can throttle based on hot spot readings even when the edge temperature looks normal. If you’re checking only one metric, you may be looking at the wrong one.
What to check first
nvidia-smi -q -d TEMPERATURE— returns both edge and hot spot readingsnvidia-smi -q -d PERFORMANCE— confirms whetherSW Thermal SlowdownorHW Thermal Slowdownflags are active- Fan speed via
nvidia-smi -q -d FAN, or chassis fan telemetry through IPMI/iDRAC - Ambient/inlet temperature via IPMI/iDRAC — distinguishes a rack-level heat problem from a card-level one
If the hot spot is elevated but the edge temperature looks fine and IPMI shows normal inlet air, the problem is localized to that card’s cooling contact, not the environment.
Power Throttling: When the GPU Hits a Hard Ceiling
If temperatures are clean but clocks are still dropping, power is the next place to look.
What causes power throttling?
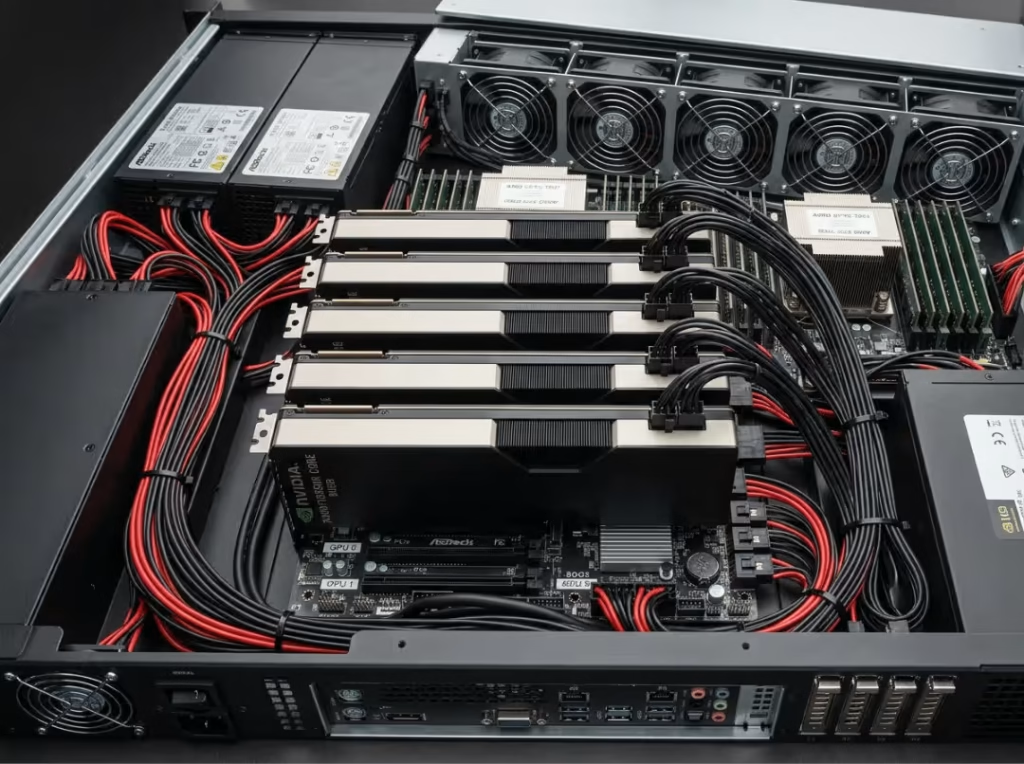
Common causes include thin PSU margin, host-level power capping enforced through the BMC or an OS power policy, an explicit power limit configured on the card, and shared power budgets in dense multi-GPU chassis where cards compete for a capped total draw.
How to tell it apart from thermal throttling
Correlate power draw against clock frequency at the same timestamp as temperature readings. A flat power ceiling paired with dropping clocks points to power, not heat. If temperatures are comfortably below the throttle threshold but clocks are still being pulled down, that’s a power limit — and the fix path is entirely different from a cooling problem.
Check these specifically:
nvidia-smi -q -d POWER— current draw versus configured power limitnvidia-smi -q -d PERFORMANCE— look forSW Power CaporHW Power Brake Slowdownflags
If power draw is pinned at a ceiling while temps stay flat, you’re looking at a power constraint, full stop.
When Temperatures and Power Both Look Normal
This is where diagnosis gets more deliberate. If thermal and power telemetry both check out but the GPU is still throttled, the cause sits in one of three less obvious categories.
Software or driver limits
Aggressive power management modes, power limits left over from a prior session or script, locked P-states, outdated drivers, and compute or MIG mode configurations can all cap clock speeds without affecting thermal or power flags.
Run nvidia-smi -q -d CLOCK alongside SUPPORTED_CLOCKS to see if current clocks match what the card can actually reach. Check nvidia-smi -q -d PERFORMANCE for P-state — anything other than P0 under sustained load is worth investigating. Confirm the driver version against the latest validated release for the card. Try manually locking clocks with nvidia-smi -lgc to isolate whether a software cap is the culprit.
Firmware or BIOS limits
GPU vBIOS power or thermal limits, server BIOS power-saving profiles or C-states, BMC firmware applying its own capping policy, and PCIe link speed or width negotiated below spec are all firmware-layer possibilities. Version mismatches across vBIOS, system BIOS, and BMC firmware can also produce inconsistent throttling behavior between otherwise identical nodes.
Run nvidia-smi -q -d VBIOS, review server BIOS power settings, and check nvidia-smi -q -d PCIE to confirm the card is running at its rated link speed and width.
Physical or hardware issues
PCIe riser or cable problems — common in dense chassis that use risers instead of direct slots — loose or corroded power connectors, worn fans, and aging cards near end of life all belong in this category.
Reseat the card, risers, and power cables as a first physical step. Log voltage with nvidia-smi -q -d VOLTAGE where supported. Compare behavior against an identical card in the same slot to determine whether the issue follows the card or the slot.
A Practical Workflow to Diagnose GPU Throttling
Once you understand the four cause categories, the diagnostic process follows a consistent sequence.
- Scope the problem. Is it one GPU or all of them? One workload type or every job? One chassis or fleet-wide? Narrowing the scope before touching anything avoids chasing a phantom.
- Log telemetry during a real workload — not a synthetic benchmark — using
nvidia-smi dmonan equivalent continuous logging tool. Idle-state telemetry will not surface a load-dependent limit. - Apply a decision map to the data:
- Temperature elevated, power below limit → thermal path
- Power pinned at ceiling, temperature normal → power path
- Clocks capped, temperature and power both normal → software or firmware
- Link degraded or inconsistent across reboots → hardware
- Change one variable at a time — cooling, power limit, driver version — and re-test before moving to the next. Changing multiple things at once makes it impossible to attribute the fix.
- Cross-check with a second tool. DCGM or GPU-Z for NVIDIA,
rocm-smifor AMD. If two tools agree, the reading is trustworthy. - Compare against a known-good baseline — same card, same workload, different node. A divergence here isolates whether the problem is hardware-specific.
Most throttling cases resolve to a clear category within the first two or three steps.
FAQs
Why is only one GPU throttling in my multi-GPU server?
A single card throttling while the rest run normally points to something card-specific or slot-specific — uneven airflow reaching that position, a degraded fan on that card, or a PCIe riser issue unique to that slot. Compare telemetry directly against an identical card in a different slot to determine whether the issue follows the card or the position.
Can a GPU throttle even if temperatures look normal?
Yes. Power limits, software caps, firmware settings, and hardware problems can all trigger throttling with temperatures well within range. If thermal telemetry looks clean, move to power draw next, then check software, firmware, and physical connections.
How do I tell thermal throttling apart from power throttling?
Correlate temperature and power draw at the same timestamp. Temperature elevated with power below its limit points to thermal. Power pinned at a ceiling with temperature normal points to power. The nvidia-smi -q -d PERFORMANCE output will also flag which slowdown condition is currently active.
Does server-level power capping (BMC/IPMI) affect GPU clocks?
Yes. Host-level power policies enforced through the BMC can cap total system draw, which limits how much power is available to the GPU. This shows up as a power throttling pattern even when the card’s own configured power limit looks unrestricted.
Why does my GPU throttle under load but look fine at idle?
Throttling is a load-dependent response. It triggers only when the GPU approaches a thermal, power, or other operational limit — which happens under sustained workload, not at idle. Idle-state checks will miss it, which is why logging during a real job is the only reliable method.
Diagnosing GPU Throttling Comes Down to Method
A throttled GPU isn’t a mystery — it’s a card hitting a limit. Separate the cause groups before investigating, log telemetry during a real workload rather than at idle, change one variable at a time, and always compare against a baseline. Follow that sequence and most cases resolve to a clear category within a handful of checks.
Once you’ve identified which limit your GPU is hitting, the next step is fixing it. The full diagnose-and-fix guide covers the deeper remediation steps for each cause category.
