


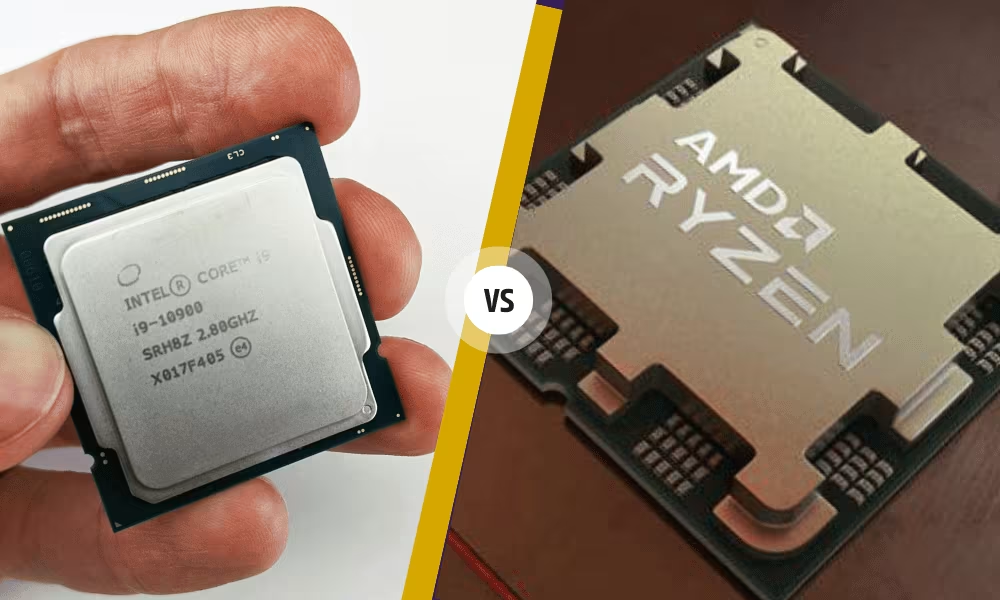
Choosing a server CPU by core count alone is one of the most expensive mistakes in infrastructure buying. A processor with more cores can look like the obvious winner on a spec sheet, then quietly triple your software licensing bill and strain your cooling budget for the next five years. The Intel vs AMD server decision deserves better than a “more cores wins” reflex.
This article takes a different approach from most comparison content. Instead of vague claims like “Intel is better for single-thread work” with no context, we lock down specific processor generations, map real workloads to each platform, show you how to verify performance yourself, and give you a decision matrix you can actually use. By the end, you’ll be able to match your dominant workloads, budget, and growth plans to the right platform—backed by evidence, not brand loyalty.
Here’s what you’ll learn: which chip generations we’re comparing and why that matters, how each platform performs across six real workload types, how to read benchmarks without getting fooled, and how to build a total cost of ownership (TCO) model that reflects your actual spending.
First, Define the Comparison Scope
Most Intel vs AMD articles fail before they start because they compare “Xeon” against “EPYC” as if each were a single, stable product. They aren’t. Generations differ enormously in core counts, memory bandwidth, PCIe lanes, and efficiency. A conclusion drawn from a three-year-old chip can be flatly wrong today.
So we’ll be specific. This comparison focuses on current-generation platforms:
- Intel: 5th Gen Xeon Scalable (Emerald Rapids) and Xeon 6, which splits into two lines—Granite Rapids (P-core) for high per-core performance, and Sierra Forest (E-core) for high-density, efficiency-focused throughput.
- AMD: EPYC Genoa (9004 series) and Turin (9005 series), with Turin offering two core types—Zen 5 for peak per-core performance and Zen 5c for maximum core density.
Why Generation and Core Type Matter
Notice that both vendors now ship two distinct core philosophies. Intel’s P-core and E-core lines, and AMD’s Zen 5 and Zen 5c variants, target completely different goals. Comparing a dense E-core or Zen 5c part to a performance P-core or Zen 5 part is meaningless unless you match it to the workload.
That’s the core discipline of this guide: every conclusion assumes the same generation, comparable SKU tiers, and a clearly defined workload. Cross-generation comparisons—such as pitting an older Xeon against a current EPYC—yield misleading results and should be ignored.
Keep One Comparison Rule in Mind
Before any spec discussion, anchor on this: cores, memory channels, PCIe lanes, and TDP only mean something when tied to a named generation and a real workload. Keep that rule as you read the tables below.
Architecture and Specs Comparison
The table below summarizes the platform’s headline specifications. Treat these as directional ranges that vary by specific SKU—always confirm exact figures against Intel ARK and AMD’s official product pages before purchasing, since vendors update SKUs and specifications frequently
| Platform | Generation | Max Cores (per socket) | Memory Channels | Memory Type | PCIe Gen | CXL Support | TDP Range |
|---|---|---|---|---|---|---|---|
| Intel Xeon | 5th Gen Scalable (Emerald Rapids) | Up to ~64 | 8 | DDR5-5600 | PCIe 5.0 | CXL 1.1 | ~250–385W |
| Intel Xeon | Xeon 6 P-core (Granite Rapids) | Up to ~128 | Up to 12 | DDR5 / MRDIMM | PCIe 5.0 | CXL 2.0 | High (verify per SKU) |
| Intel Xeon | Xeon 6 E-core (Sierra Forest) | Up to ~288 | Up to 12 | DDR5 | PCIe 5.0 | CXL 2.0 | Efficiency-focused (verify) |
| AMD EPYC | Genoa (9004) | Up to 96 | 12 | DDR5-4800 | PCIe 5.0 | CXL 1.1+ | ~200–400W |
| AMD EPYC | Turin (9005, Zen 5) | Up to 128 | 12 | DDR5-6000 | PCIe 5.0 | CXL support | Up to ~500W (verify) |
| AMD EPYC | Turin (9005, Zen 5c) | Up to 192 | 12 | DDR5 | PCIe 5.0 | CXL support | High-density (verify) |
Data ranges are directional. Confirm exact core counts, memory speeds, lane counts, and TDP against Intel ARK and AMD product pages for the specific SKU you’re evaluating.
Core Count and Thread Density
AMD’s dense Zen 5c parts and Intel’s Sierra Forest E-core line both push very high core counts per socket. This density drives consolidation—running more virtual machines or containers on fewer physical servers. If your workloads are spread across many threads, high density translates directly into fewer boxes and lower rack costs.
Memory Subsystem
Memory bandwidth often decides real-world performance more than raw clock speed. AMD’s 12-channel design has been a consistent advantage for bandwidth-hungry work; Intel’s Xeon 6 now also reaches up to 12 channels and adds MRDIMM support on certain platforms. Higher bandwidth directly benefits databases, analytics, and HPC.
I/O, PCIe, and CXL
Both platforms offer abundant PCIe 5.0 lanes, which matter for GPUs, NVMe storage arrays, and high-speed networking. CXL support—now advancing to CXL 2.0 on Xeon 6—opens the door to memory expansion and pooling. If you plan to attach multiple accelerators or large storage pools, count available lanes carefully per SKU.
Workload-by-Workload Analysis
This is where generic articles fall short and where your decision is actually made. Below, each workload follows the same structure: characteristics, which platform fits, why, and what to verify.
Virtualization and Containers
Characteristics: Many independent VMs or containers, high aggregate thread demand, consolidation-driven.
Fit: Leans AMD (Zen 5c) or Intel Sierra Forest for maximum density.
Why: High core counts let you consolidate more guests onto fewer hosts, cutting hardware, rack, and cooling costs. A single dense socket can replace multiple older servers.
What to verify: Per-socket vs. per-core licensing for your hypervisor. VMware’s licensing model can reverse the economics—more cores may raise your subscription cost enough to offset hardware savings. Model licensing before you buy on density.
Relational Databases: OLTP vs OLAP
These two database patterns pull in opposite directions, so treat them separately.
OLTP (transactional):
- Characteristics: Latency-sensitive, benefits from fast individual cores and low memory latency.
- Fit: Leans toward high per-core parts—Intel Xeon 6 P-core or AMD Zen 5.
- Why: Transactional throughput often depends on single-thread speed rather than core count.
OLAP (analytical):
- Characteristics: Scans large datasets, rewards memory bandwidth and parallelism.
- Fit: Leans toward high-bandwidth, high-core configurations.
- Why: Analytical queries parallelize well and saturate memory channels.
What to verify: Per-core licensing exposure. Oracle’s core factor and SQL Server’s per-core model can make a high-core chip dramatically more expensive to license. Match the SKU to the database license math, not just the benchmark.
High-Performance Computing (HPC)
Characteristics: Massively parallel, bandwidth-intensive, sensitive to performance-per-watt at scale.
Fit: Often leans toward AMD for core density and memory bandwidth per node.
Why: More cores and channels per node improve throughput for many parallel solvers, and strong performance-per-watt controls energy costs across large clusters.
What to verify: Whether your specific solver benefits from raw core count or from high single-core frequency. Some codes scale with cores; others are frequency-bound. Test with your actual application, not a generic HPC benchmark.
AI Inference and Light Training
Characteristics: Ranges from pure CPU inference to CPU-plus-GPU pipelines.
Fit: Depends on your accelerator strategy—so decide that first.
Why: For CPU-side inference, Intel’s built-in AMX accelerators can handle certain inference workloads efficiently without add-in cards. For GPU-driven training, available PCIe 5.0 lanes for multiple accelerators become the deciding factor, favoring whichever platform gives you the lane count and topology you need.
What to verify: Whether your models run acceptably on CPU inference or require dedicated GPUs, and how many PCIe lanes your GPU configuration demands per socket.
Storage Nodes and Software-Defined Storage
Characteristics: I/O-rich, NVMe-dense, benefits from high lane counts and memory expansion.
Fit: Leans toward platforms with abundant PCIe lanes and CXL memory support.
Why: Storage-heavy nodes need lanes for NVMe drives and network cards. CXL memory expansion can add capacity flexibly for caching and metadata.
What to verify: Total PCIe lanes after accounting for networking, and CXL support maturity on your chosen SKU and OS.
Web and Application Hosting
Characteristics: Scales with concurrency; behavior shifts with deployment size.
Fit: Genuinely can go either way—here’s how to break the tie.
Why: Moderate-concurrency workloads often favor higher single-core performance to ensure responsive request handling. Very large-scale-out deployments favor cost-per-dollar compute and density.
What to verify: Your concurrency profile and scaling model. Small-to-mid concurrency leans single-core; hyperscale leans dense, value-driven parts.
Section recap: No single platform wins every workload. Consolidation and bandwidth-heavy workloads lean toward AMD or Intel’s dense lines; latency-sensitive transactional work leans toward high-per-core parts; and hosting depends on scale. Always confirm licensing and lane counts.
How to Read Benchmarks Without Getting Fooled
Benchmarks settle arguments—if you read them correctly. The goal is to verify claims yourself rather than trust a vendor slide.
Which Benchmarks to Trust
- SPEC CPU 2017: Industry-standard for integer and floating-point performance. Read single-core and multi-core results separately; they tell different stories.
- Performance-per-watt benchmarks: Critical for dense deployments where energy dominates operating cost.
- Application-level benchmarks: TPC-style database tests, compilation, and rendering reflect real work better than synthetic scores.
Trusted Third-Party Sources
- Phoronix: Broad Linux workload testing across many real applications.
- ServeTheHome: In-depth server platform reviews with practical configurations.
- SPEC official results database: Vendor-submitted but standardized and comparable.
- Intel ARK and AMD product pages: Authoritative for official specs and TDP.
Three Common Benchmark Pitfalls
- Mixing single-core and multi-core results. A chip can dominate multi-core scores while trailing on single-core—know which one your workload needs.
- Treating TDP as actual power draw. TDP is a design figure, not a live measurement. Real consumption depends on workload and configuration.
- Trusting one vendor’s testing methodology. Cross-check claims across independent sources with matched test conditions before drawing conclusions.
Ecosystem Maturity and Software Certification
The claim “Intel has a more mature ecosystem” is common. Turn it into a checklist you can verify, rather than a slogan you accept.
ISV Certifications and OS Support
Confirm that your critical software is certified on your chosen platform. Specifically check:
- VMware vSphere compatibility and support statements
- Red Hat Enterprise Linux and SUSE certification
- Windows Server support
- SAP HANA certified configurations
- Microsoft SQL Server support and licensing notes
OEM and Supply Chain Coverage
Check model availability from Dell, HPE, Lenovo, and Supermicro for your target CPU. Breadth of certified server models affects both procurement lead times and long-term maintenance. A platform with more chassis and configuration options gives you sourcing flexibility.
Operations and Team Familiarity
Your team’s existing experience carries a real, if hidden, cost. Adopting a less familiar platform may require training and process changes. Factor this learning curve into your timeline, especially for mission-critical rollouts.
The Realistic Conclusion
The compatibility gap has narrowed dramatically—both platforms run mainstream software well. For most modern deployments, certification is no longer a dealbreaker. For a few legacy or heavily regulated environments, verify each certification line by line rather than assuming.
Total Cost of Ownership: Where the Bill Is Really Decided
Sticker price is the smallest part of the story. Build a 3–5 year TCO model that combines four cost categories, or you’ll miss the expenses that actually dominate your budget.
1. Hardware Acquisition Cost
Compare cost per core across the CPU, platform, memory, and I/O configuration—not just the chip price. A cheaper CPU can require more expensive supporting components.
2. Software Licensing (The Most Underestimated Cost)
Per-core licensing can dwarf hardware savings. High-core chips are especially exposed here:
- Oracle Database: Uses a core factor mechanism that multiplies licensable cores by a per-processor factor—verify the current factor for your chosen CPU.
- Microsoft SQL Server: Licensed per core, so more cores mean proportionally higher license cost.
- VMware: Licensing terms have shifted toward subscription and per-core models—confirm current terms.
The key insight: money saved on hardware can be erased—or reversed—by per-core licensing. Always run the license math before choosing a high-core part.
3. Power and Cooling (Over 3–5 Years)
Energy is a recurring, compounding cost. Estimate it with this framework:
Annual energy cost ≈ Average power draw (kW) × Operating hours × Electricity rate × PUE
Higher-density consolidation reduces the number of racks and the cooling load, which can lower this figure substantially even if per-socket power is high.
4. A Simplified TCO Modeling Framework
Rather than trust a headline price, total these components over your planned lifecycle:
Total TCO (3–5 yr) =
    Hardware cost
  + (Per-core license cost × licensable cores)
  + (Annual energy cost × years)
  + Support and maintenance
Plug in your own SKU prices, license terms, electricity rate, and PUE. This full view often reveals a different “cheapest” option than the purchase price alone would suggest.
Section recap: The lowest-priced server is rarely the lowest-cost solution. Licensing and multi-year power costs often outweigh hardware differences—model all four categories before deciding.
Decision Matrix: Turn Analysis Into Action
Use this matrix to map your priorities to a platform tendency. For any row marked “Verify,” the outcome depends on your specific SKUs, licensing, and configuration.
| Decision Dimension | Lean Intel | Lean AMD | Verify |
|---|---|---|---|
| Single-core-sensitive workloads (OLTP, legacy apps) | Xeon 6 P-core strength | Zen 5 competitive | Test with your actual app |
| Consolidation density (VMs, containers) | Sierra Forest E-core | Zen 5c high density | Hypervisor licensing model |
| Cost-per-dollar compute | — | Often stronger | Confirm current SKU pricing |
| Per-core licensing share of budget | Fewer cores may reduce cost | Higher cores raise license cost | Oracle/SQL/VMware terms |
| I/O and PCIe lane density | Competitive | Competitive | Lane count after networking |
| Ecosystem / ISV certification dependency | Broad, mature | Improved, verify niche apps | Certification per application |
| Team expertise and operations | If Intel-experienced | If AMD-experienced | Training and switch cost |
Scoring Card Template
For a structured decision, assign a weight (importance) to each dimension above, score each platform 1–5, then multiply and total. This replaces gut feel with a repeatable, defensible calculation your stakeholders can review.
Clear Buyer Persona Recommendations
Here’s the part generic articles avoid: a stated position, with reasons and limits.
Choose Intel When…
- Your core business runs latency-sensitive transactional databases or legacy enterprise software that rewards strong per-core performance.
- You operate in a highly regulated environment with deep dependence on specific ISV certifications and a long track record of validation.
- You want CPU-side AI inference using built-in AMX accelerators rather than adding GPUs.
Why: Intel’s per-core performance, mature certification ecosystem, and integrated accelerators align with these predictability-first needs.
Choose AMD When…
- You run large-scale virtualization or container consolidation and want to minimize physical host count.
- You operate scale-out web, application, or analytics workloads where cost-per-dollar compute leads.
- You’re budget-sensitive and chasing maximum compute per dollar.
- Your workloads are I/O- and bandwidth-intensive, such as storage nodes and many HPC codes.
Why: AMD’s high core density, memory bandwidth, and price-to-performance suit throughput-driven, consolidation-heavy deployments.
Tiebreaker Factors for “Verify” Cases
When a workload genuinely fits either platform, let these decide:
- Licensing model — Per-core software can flip the economics entirely.
- Existing power and cooling headroom — Your facility’s limits may rule out high-TDP density.
- Team operational experience — Familiarity reduces risk and speeds deployment.
Common Misjudgments to Avoid
- Buying on core count alone without matching workloads
- Ignoring per-core licensing exposure
- Underestimating power and cooling over the lifecycle
- Forgetting to leave headroom for growth
Conclusion: Decide on Evidence, Not Brand Loyalty
There’s no universal winner between Intel and AMD—only the platform that best fits your workloads, budget, and growth plans. Intel Xeon 6 is well-suited to latency-sensitive, certification-dependent, and per-core-heavy environments. AMD EPYC is well-suited to high-density, scale-out, bandwidth-intensive, and value-driven deployments.
Your next steps are concrete: profile your dominant workloads honestly, build a 3–5 year TCO model that includes licensing and power, and run the decision matrix to confirm your lean. Then verify the “Verify” rows against official specs and your own tests. Do that, and the platform you pick will hold up for years—chosen on evidence, not habit.
Appendix
Glossary
- TDP (Thermal Design Power): The maximum heat a CPU is designed to dissipate, used for cooling planning. It is a design figure, not a live power measurement.
- CXL (Compute Express Link): An interconnect standard enabling memory expansion and pooling between the CPU and attached devices.
- PUE (Power Usage Effectiveness): A data center efficiency ratio of total facility power to IT equipment power. Lower is better; 1.0 is ideal.
- Consolidation ratio: The number of virtual machines or workloads running on a single physical server. Higher density enables higher ratios.
- Per-core licensing: A software pricing model that charges based on the number of CPU cores, which can make high-core processors more expensive to license.
Pre-Purchase Checklist
- Confirmed exact core counts, memory speeds, PCIe lanes, and TDP on Intel ARK / AMD product pages
- Verified ISV certifications for all critical applications (VMware, RHEL/SUSE, Windows Server, SAP HANA, SQL Server)
- Checked OEM model availability and lead times (Dell, HPE, Lenovo, Supermicro)
- Calculated per-core licensing exposure (Oracle core factor, SQL Server, VMware terms)
- Estimated 3–5 year power and cooling cost using your electricity rate and PUE
- Confirmed power and cooling headroom in your facility for the target TDP
- Left headroom for core, memory, and storage growth over the lifecycle
- Cross-checked benchmark claims against independent sources
Recommended Reading
- Intel ARK — Official specifications for every Xeon SKU
- AMD EPYC product pages — Official specifications and platform details
- SPEC CPU 2017 results database — Standardized, comparable performance data
- Phoronix — Broad Linux workload benchmarking
- ServeTheHome — In-depth server platform reviews and configuration guidance
Always confirm current specifications, licensing terms, and benchmark results against these official and independent sources before finalizing a purchase.
Frequently Asked Questions
Which is better for virtualization, Intel or AMD?
AMD EPYC (Zen 5c) and Intel’s Sierra Forest E-core line both excel at virtualization because their high core counts let you run more VMs on fewer physical hosts. That density cuts hardware, rack, and cooling costs. But check your hypervisor’s licensing model first. Per-core licensing, as in some VMware terms, can raise your subscription cost enough to offset the hardware savings from consolidation.
Does AMD cost more to license than Intel?
It can. AMD’s high core counts are an advantage for raw compute, but many enterprise applications charge per core. So a 96-core or 128-core EPYC chip may cost far more to license than a lower-core Intel Xeon in the same tier. This primarily affects software such as Oracle Database, Microsoft SQL Server, and VMware. Always run the license math on your specific SKU before assuming AMD is cheaper.
What is Intel AMX and why does it matter?
AMX (Advanced Matrix Extensions) is a built-in accelerator in Intel Xeon processors designed to speed up AI inference directly on the CPU. It matters because it can handle certain inference workloads efficiently without add-in GPUs. If your AI needs are limited to CPU-side inference rather than large-scale training, AMX may let you skip separate accelerator cards and reduce hardware cost.
Which is better for databases, Intel or AMD?
It depends on the database pattern. For OLTP (transactional) workloads, which are latency-sensitive and reward fast individual cores, high per-core parts like Intel Xeon 6 P-core or AMD Zen 5 lean ahead. For OLAP (analytical) workloads, which scan large datasets and benefit from memory bandwidth and parallelism, high-bandwidth, high-core configurations win. Match the SKU to both your query pattern and your per-core license math.
How do I calculate the total cost of ownership for a server CPU?
Build a 3–5-year model that includes four cost categories: hardware acquisition, per-core software licensing, power and cooling, and support. Use this framework: Total TCO = hardware cost + (per-core license cost × licensable cores) + (annual energy cost × years) + support and maintenance. Estimate annual energy as average power draw (kW) × operating hours × electricity rate × PUE. This full view often reveals a different “cheapest” option than sticker price alone.
Is AMD EPYC always cheaper than Intel Xeon?
No. AMD often delivers stronger cost-per-dollar compute performance on hardware, but the overall picture depends on software licensing and power consumption. A cheaper chip with more cores can lead to higher per-core license fees, which can reverse the savings. The lowest-priced server is rarely the lowest-cost solution once you model licensing and multi-year energy costs.
What’s the difference between Intel P-core and E-core in Xeon 6?
Xeon 6 splits into two lines with different goals. Granite Rapids (P-core) targets high per-core performance for latency-sensitive and single-thread-heavy workloads. Sierra Forest (E-core) targets high density and efficiency, packing more cores per socket for throughput-driven consolidation. Comparing a dense E-core part to a performance P-core part only makes sense when you tie it to a specific workload.
Should I choose a server CPU based on core count alone?
No. Core count is one of the most misleading specs to buy on. More cores can drive up per-core licensing costs and add cooling demands, while some workloads actually run better on fewer, faster cores. Always anchor your decision to your actual workloads, then verify licensing exposure and power headroom before committing.
Which platform is better for AI workloads?
It depends on your accelerator strategy, so decide that first. For CPU-side inference, Intel’s built-in AMX accelerators can run certain workloads without GPUs. For GPU-driven training, the deciding factor is the number of available PCIe 5.0 lanes for multiple accelerators, favoring whichever platform provides the lane count and topology your configuration needs.
How do I verify a CPU’s specs before buying?
Confirm exact core counts, memory speeds, PCIe lanes, and TDP against Intel ARK and AMD’s official product pages, since vendors update SKUs frequently. Cross-check performance claims against independent sources such as Phoronix, ServeTheHome, and the SPEC CPU 2017 results database. Read the single-core and multi-core benchmark results separately, and remember that TDP is a design figure, not the actual power draw.
